Into the Dataverse
Isabella Arrazola | Grad
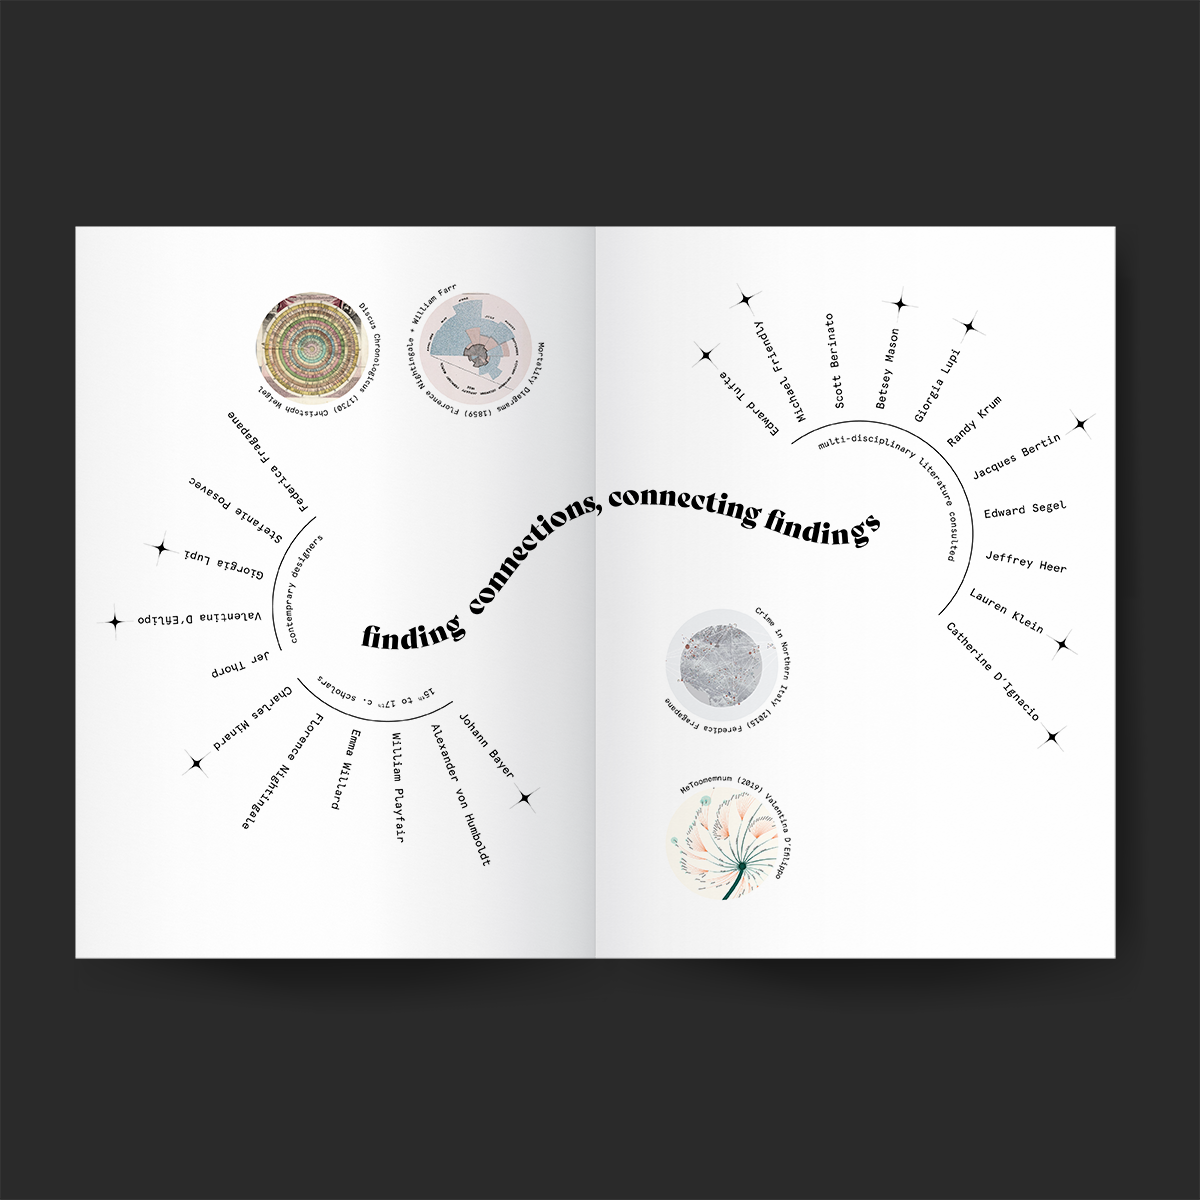
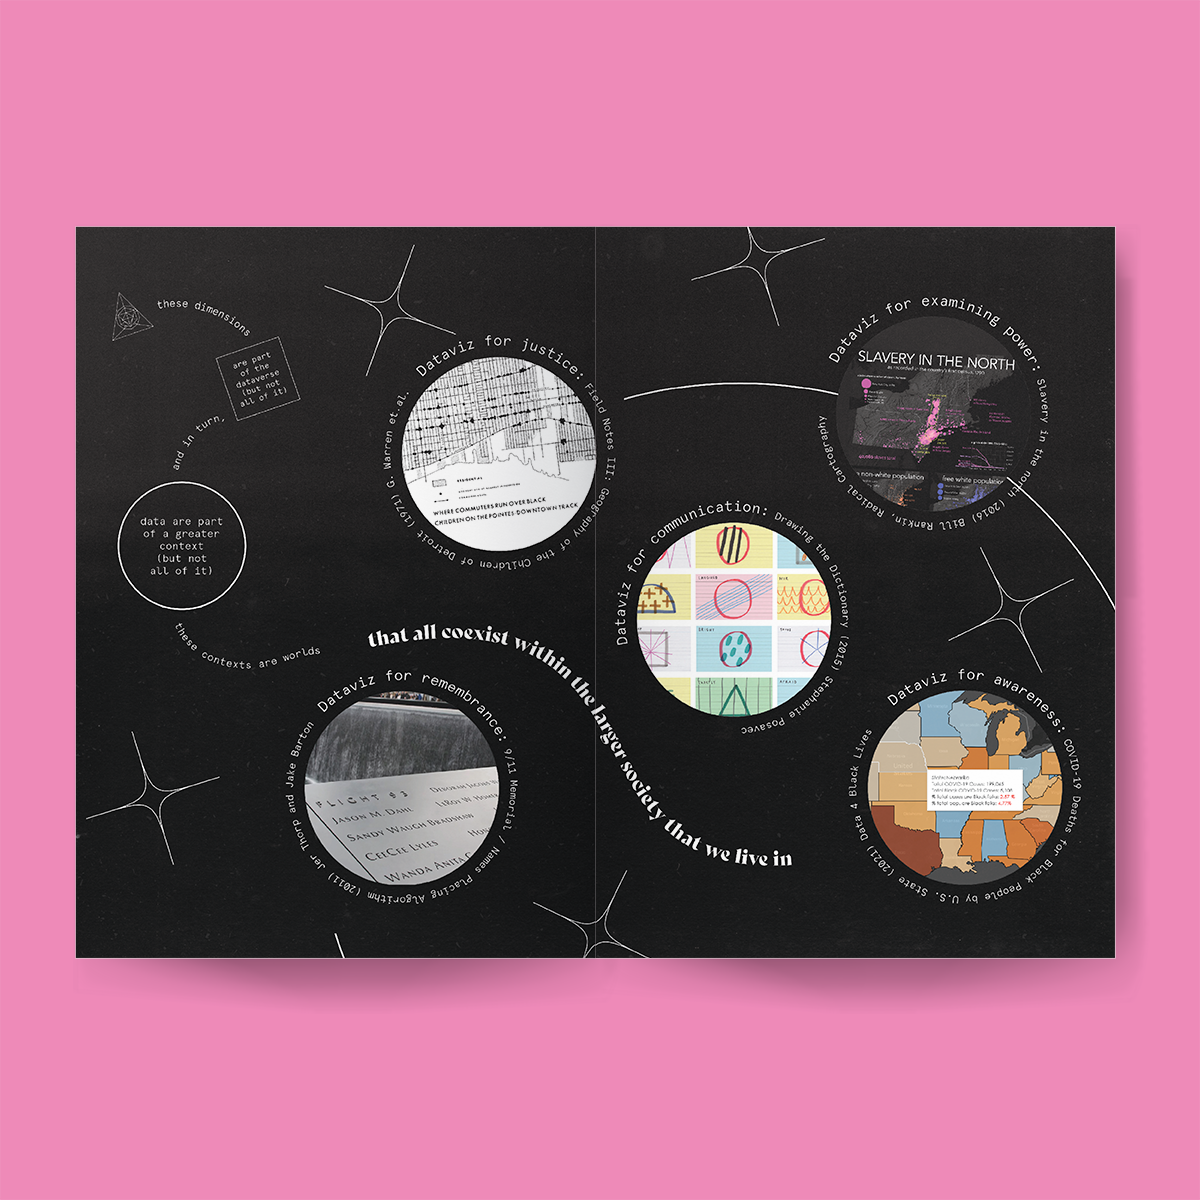
Infographic visualization and meta-reflection on data visualization. This booklet shows my experience as a graphic designer delving into the world of data visualization for the first time, and what I discovered during the process of making. For the narrative of this project, I used Johannes Kepler's Cosmographicum model as a visual metaphor for the journey of this research, with each geometric figure representing a phase of my learning. Final project for MXD MFA Spring 2022.